


Table of Contents
Share this article
Learn from the brightest minds how to predictably and efficiently grow revenue.
Related Content
Improve your win rates by 117% by spotting these slippage red flags
easily identify the telltale signs of risk that an opportunity is going to slip. Equipped with this knowledge, sales teams can then be proactive to salvage these opportunities, close them faster and improve win rates.
How to Analyze your Sales Pipeline – Measuring Your Pipeline Health
The key to understanding how your pipeline is performing is knowing what state it is in. The gauge of that is pipeline health. In the first of our series, we looked at creating the foundations of your pipeline and the metrics that are needed to know what is happening within it. In this article, we…
What is Revenue Operations?
They say all roads lead to Rome. If you imagine Rome as revenue, then the role of revenue operations is to make sure that those roads are built in the most efficient way and that they are effectively signposted. Revenue operations, or “rev ops” in it’s shortened form, is the strategic alignment of sales, marketing,…
How Set Up Historical Trend Reporting in Salesforce
Table of Contents
A Guide to Set Up Trend Reporting in Salesforce
Reporting in Salesforce is one of the most powerful features you have when trying to demonstrate the value of a business. Building key reports in a matter of minutes with a simple drag and drop interface that anyone can use is extremely effective. Being such a vital part of any business, it’s essential that as an Administrator you have a good idea of all the options available to you.
Let’s have a look at why you should be using Trend Reporting in Salesforce and how to use it.
What is Historical Trend Reporting?
Historical trend reporting is a tested-and-tried way to keep track of the performance of one’s business over time. Sales managers use the feature to check on the overall business progress by conducting a side-by-side comparison of sales pipelines between two or more different periods. The presence of a drag-and-drop interface that calls for minimal Salesforce reporting training for users is mainly what gives this tool the edge on other data history tracking systems.
Historical Trend Reporting is still a new feature for a lot of people. It makes use of the Snapshot Reporting feature but is more focused on capturing small day-to-day or week-to-week changes happening in the sales pipeline. You can select data at up to 5 different points in time and view them in one row to check for direct data changes.
If you are only getting started with Salesforce, note that reports may time out or get lost for good if you set the prolonged duration between date snapshots. That said, you can be sure to access and manipulate data from up to three months ago, excluding the current month. You can choose whatever duration you feel suits your model and scale of business.
What Are the Benefits of Setting Up Historical Trend Reporting?
A historical trend report can help you monitor your company’s sales pipeline to make sure it contains enough activity to meet current and future sales goals. Below is a list of the key benefits of using Historical Trend Reporting:
1. Monitor Changes in Your Pipeline
A sales pipeline enables you to track the movement of a prospect as they go from being a lead to making the purchase or scheduling an appointment. Pipelines help sales managers make crucial decisions about company objectives, individual targets, and new opportunities. Sales teams can also use the pipeline system to track pending deals at any given time and estimate the productivity of different agents.
Historical reports can be used to monitor activity in the pipeline and check on the progress of specific deals over a given period. They allow you to delve into figures, dates, status, and other details that could be adding up to impact the look of your pipeline. With the help of historical trending Salesforce lightning reports, you can compare the past and present values of your pipeline and see if the trend aligns with your business goals.
2. Assess Deals Below or Over a Given Value
Another instance where historical trending may come in handy is when you want to focus on deals that fall within a specific value range. If you wish to view the status of deals worth, say, $1,000 or more, a historical trending report will help you identify all deals that cut.
3. Focus on Deals that are Losing Value
You can also create a Lightning report to focus on deals that are taking too long to close or are experiencing a dip in value. A trending report will let you filter out deals that have increased in value, leaving you with the under-performing ones. This way, you will have fewer data to play with and more apparent paths to the underlying problems.
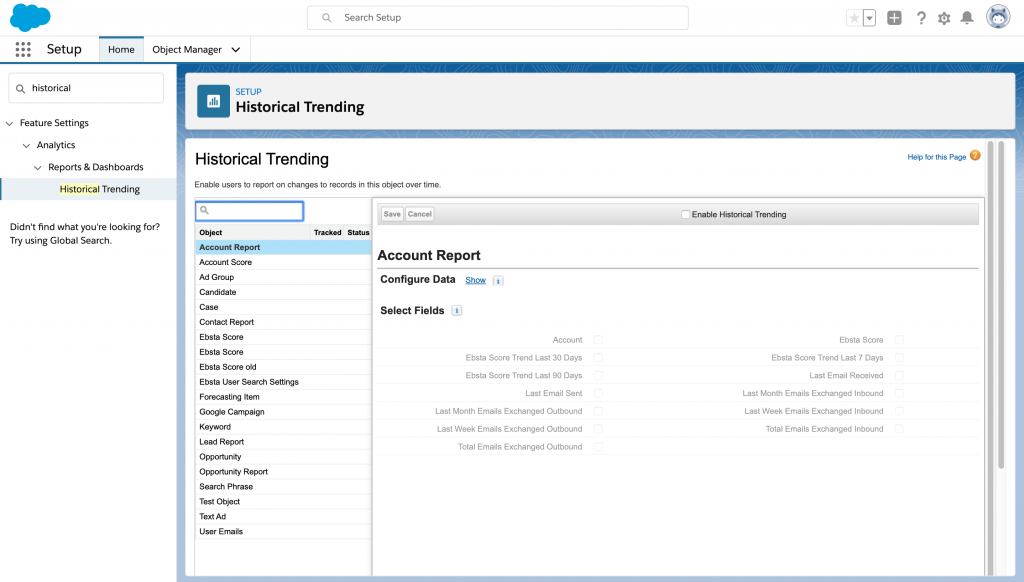
- From Setup, enter Historical Trending in the Quick Find box, then select Historical Trending.
- Select the object that you want to do historical trend reporting on. …
- Select Enable Historical Trending.
- To narrow down the amount of data that’s captured for historical trend reporting, use the filters under Configure Data.
What you are doing here is comparing a historical amount with today’s amount, collectively capturing all deals that are shrinking in value.
4. Track Changes in Forecast Amounts
Through a trending historical report, you can get to assess the accuracy of individual team members at estimating future sales. Salesforce lets you make a comparison of two points in time of your choice with the utmost ease.
- Go to the Reports tab on the panel and create a New Report. Select Forecasts on the Select Report Type tab and set up the filters to your liking. The Date Field and Historical Date tabs allow you to choose the period you want to focus on and the specific points in time whose data you want to compare.
- Next, you will choose the data you want to monitor, which, in this case, is where and how the forecast amounts changed. You can play with the filters as much as you want until you find the data you want in your report. You even get the chance to create a graphical representation of your data for a more condensed and inclusive view.
5. Track Case History
Keeping in mind cases undergo distinct changes over time, you may need to review each one of them separately for more workable solutions. Observe the status field over time and point out the causes that are making progress. Pick out the ones developing retrogressively and focus on them. Also, regularly check the priority field for potential wrongful classification of cases.
Steps to Creating Historical Trend Reporting
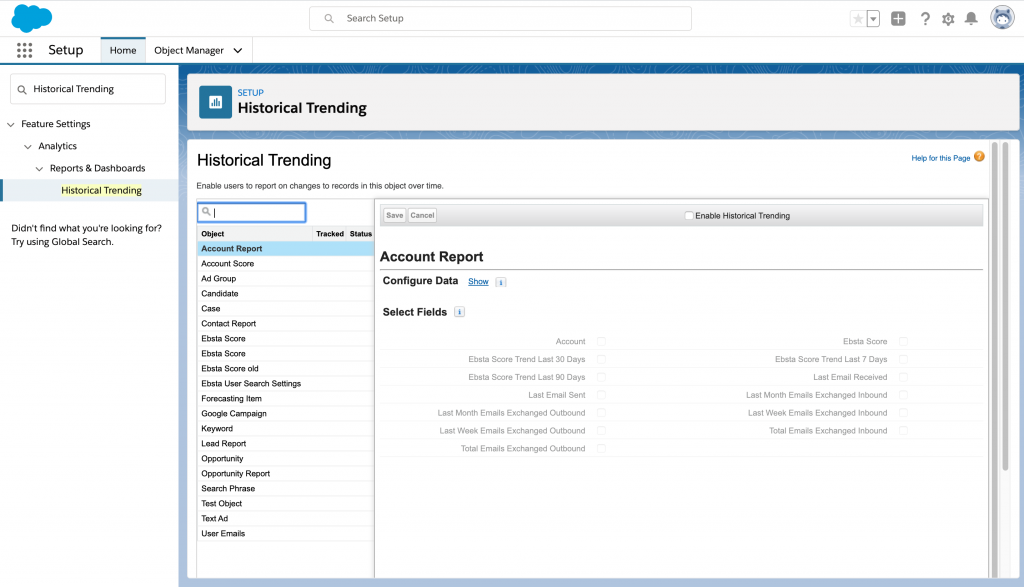
- From Setup, enter Historical Trending in the Quick Find box, then select Historical Trending.
-
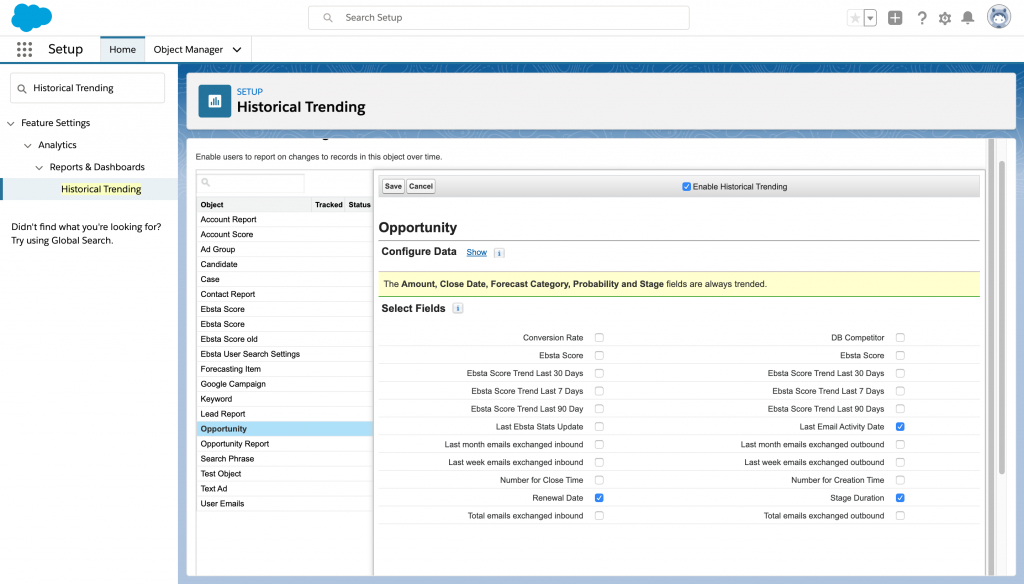
Select the objects that you want to perform Historical Trend Reporting on. You can select Cases, Opportunities, Forecasting Items and up to three custom objects. Select Enable Historical Trending.
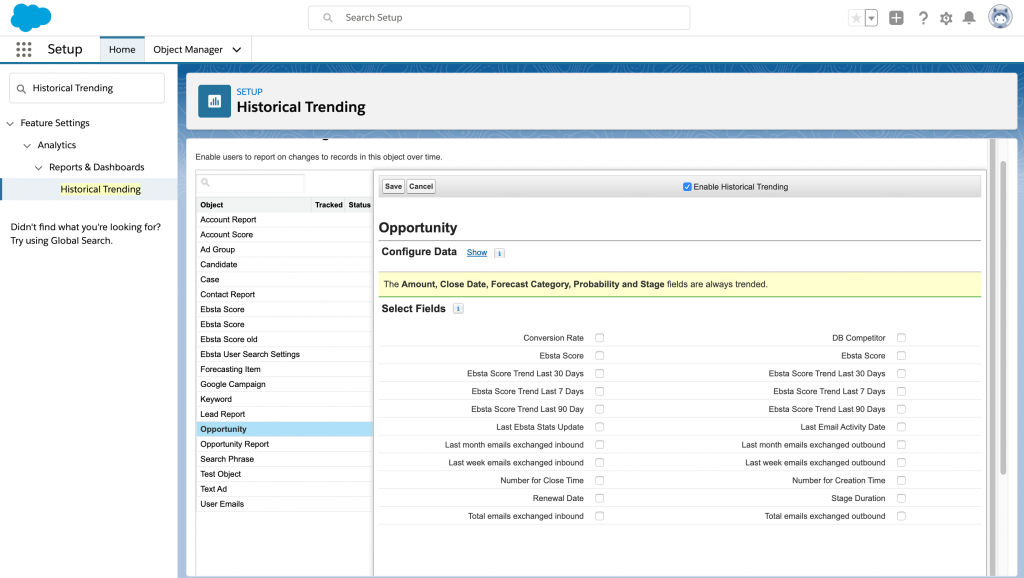
- Mention the amount of data you can use to create Historical Trend Reports by using the filters under Configure Data. You can narrow down historic data for Cases, Opportunities and custom objects. For Forecasting Items, the available data is selected for you.
- Under Select Fields, select up to three fields to make available for Historical Trend Reporting. Click Save.
Need Some Help?
With a comprehensive CRM like salesforce, you are not only improving the productivity of your sales team but also understanding your clients better and getting a view of your business from their perspective.
We’re here to help if you want to take your salesforce forecasting to the next level. Ebsta Team enables you to track true engagement in your forecast, enabling you to spot opportunities at risk to increase close rates.
You can request a demo here.