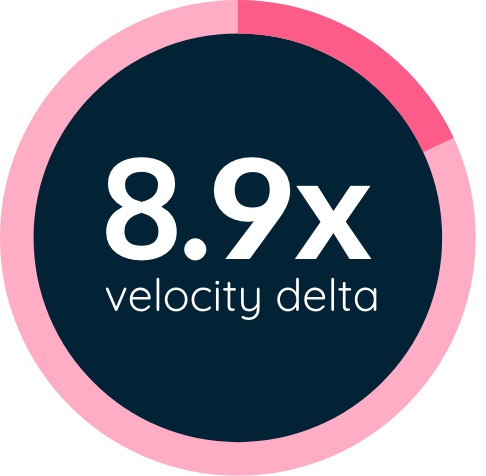
Sales Velocity
Pinpoint which quarters revenue was accelerating at its peak and where it slowed

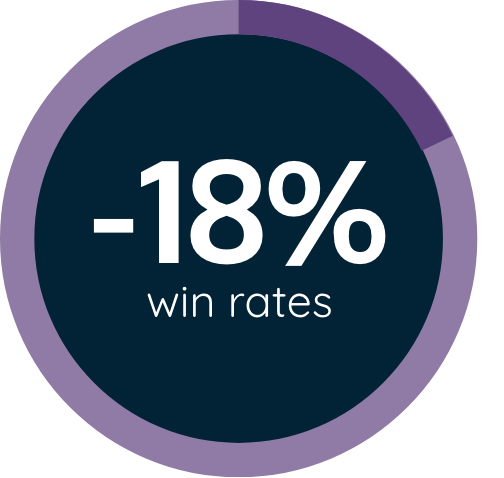
Win Rate
Uncover how successful peers were at closing successful (and unsuccessful) deals in their pipeline

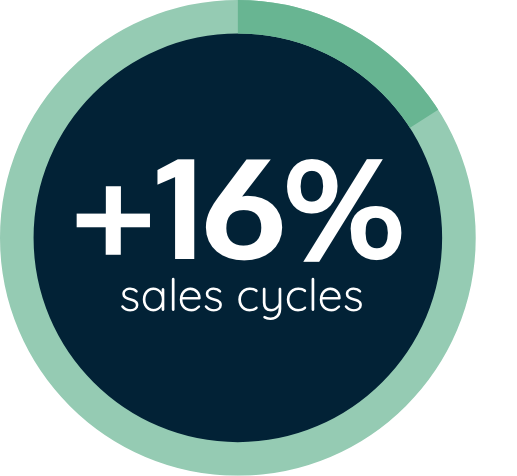
Sales Cycle
Uncover where sales cycles were at their shortest and when they stretched further than average

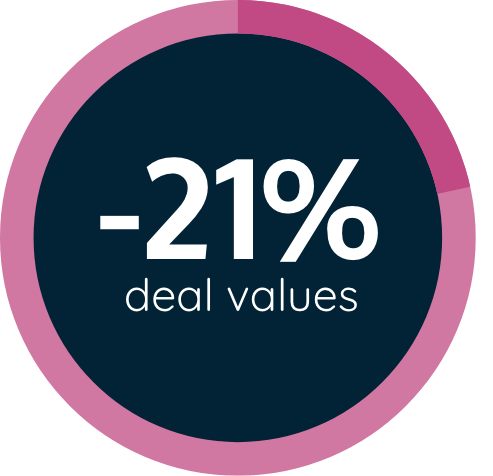
Average Deal Value
Understand how deal values were impacted in relation to the swiftly-changing buyer landscape

Relationships
Revealed: How many relationships were the benchmark for success, and also - how relationships underpinned the success of all our key performance indicators

Engagement
Discover how engagement impacted deals across the year and how its measurement provided a key indicator of success
We Want To Hear Your View
As our benchmark report evolves, we would love to hear more from you about your experiences. Has it aligned with what the data showed? Were you able to buck the trend? This report is all about discovering how we’ve each performed and sharing insights on how to improve and generate more revenue, so get in touch!
Share
Introduction
2020 will live long in the memory. For so many reasons, the world we live in is now permanently changed. For businesses, it’s been a period of ‘business darwinism’, where the strongest adapted to survived, and the rest have been consigned to the annals of history.
In sales, the past 12-18 months have been a watershed moment. Digital transformations which were initially planned across a 10 year time frame were fast-tracked for completion in 10 months. Evolving to become digital-first was business critical.
Sales teams had to adapt, using different tactics, channels and technology in order to survive. The silver-lining of all this, is that it forced them to be plunged into the inevitable data-driven future. ‘Gut-feeling’ forecasts were swiftly exposed, and accurate forecast became more pivotal than ever before.
Now we stand on the cusp of a bold, new, data-driven world. One which is now evolving at breakneck speed. This report is designed to provide sales leaders with the tools and insights they need to succeed in our brave new world. Our report covers five key performance indicators (win rate, sales cycle, average deal value, relationships and engagement) across five industries (software and IT, financial services, healthcare, manufacturing and real estate).
Let’s begin.
Sales Velocity
Q1 2020 was the strongest quarter for many industries - but not all…
Through the ultimate measure of performance - sales velocity - we can understand the big picture across each quarter. Q1 2020 was the strongest quarter for many industries, but not for everyone. In fact, healthcare in particularly enjoyed strong second and third quarters of 2020 as demand surged in response to the pandemic.
Real estate on the other hand a had very slow opening three quarters, but then finishing strongly in Q4 2020, before finishing on it’s strongest quarter at the beginning of 2021.
Financial services was the most consistent across the year of all the industries. It actually performed well in the early quarters of 2020, and only saw a dip in performance come the beginning of 2021.
Manufacturing was the hardest industry hit following Q1 2020. Performance gradually decreased as the quarters went on, which was not helped by a huge amount of disruption caused by countrywide lockdowns.
Finally, software and IT suffered it’s weakest quarter in Q2, but was quickly able to recover and find it’s feet in the new world we found ourselves in.
Win Rate
Win rates slumped in Q2, then grew quarter-to-quarter - but there’s more here than meets the eye
Q2 was our watershed moment, the moment when pipelines came under intense scrutiny as businesses scrambled to adapt to the new world we found ourselves in.
In the report, we discover how the number of opportunities surged in multiple industries in Q2. So it amidst greater scrutiny of existing pipeline, they were also being flooded with opportunities - but of course, not every opportunity is created equal. In addition to this, sellers were also having to adapt themselves, creating this substantial decrease.
Q3 we witness that adaption beginning to take effect. Opportunities were still high, and business models had to change to meet the now changed buyer’s needs. As those took effect, win rates began to grow across the board - however, it was still no guarantee of increased revenue.
Sales Cycle
Sales cycles for deals won remained consistent, while for deals lost the impact of increased scrutiny of pipeline is visible
The stark change in the length of sales cycle erupted in Q2 when pipelines were being closely scrutinised. Some deals came in hot and fast, while others were being held onto more in hope than expectation. As businesses scrambled to make sense of increased demand, a cutthroat appreach was needed to identify which opportunities to prioritise.
Sales cycles for deals won remained relatively consistent through the year, showing that even with increased demand, there were still many buyers with a clear view on what they needed.
As the year progresses for deals lost, the interesting thing to note is how the cycle grows quarter-on-quarter, demonstrating a growing habit for clinging to deals in hope once again. Clearly there is a need to learn to fail faster, as so many did in Q2. As the amount of time for closed deals lost grows at the beginning of 2021, greater scrutiny is required once again.
Deal Value
Deal values slumped across the year, but the gap began to close at the beginning of 2021
Business models had to adapt to the drastic change in circumstances. Freemium, ‘lite’ and discounted plans were the order of the day. Each had were designed with a single goal - to steady the ship and plug any revenue holes. This we can see kicks in during Q2.
The impact of this can be seen in Q3 as the value of deals won grew, particularly for closed deals won, suggestign that these new models were having their intended effect.
By the end of Q1 2021, the gap in value between closed won and lost closed to it’s smallest point in the year. These new strategies evidently were succeeding in closing the revenue gap. The question now is whether these will continue to thrive through 2021, or whether they will evolve as the world begins to return back to normal.
Relationships
The benchmark for relationships required to win a deal is between 4 and 5
Relationships with the buying committee are a key component of any deal. When deals were being lost, on average they only had 2 relationships associated with them.
In comparison, our analysis shows that the minimum number of relationships required to successfully close a deal sits between 4 and 5. Evidently, when the number of relationships with key stakeholders grew, so did the chance of winning the deal.
This is highlighted with an increase in Q2, when there was an evident shift to requiring more connections with the buying committee to secure a deal.
All things considered, having found the benchmark for the number of relationships required, we later found that the odds of success grew when this benchmark was exceeded (more on this below)...
Win rate grows when you build more relationships with the buying committee - but not exponentially
Between 4 and 5 relationships might be the benchmark, but when the number of relationships grew - so did the win rate. We’ve always know that relationships equal revenue, and now we can see just how impactful.
Hit that benchmark, and the average win rate is 41%. Add a few more key stakeholders, and that win rate grows to the 51%. Get a couple more on board, and it grows again to 55%. There is clear correlation between the number of relationships and the chance of success.
Where relevant, between 10 and 12 relationships carried the highest win rate, showing that nurturing connections with key members of the buying committee increases the chances of success. However, there is such a thing as too many cooks spoiling the broth as the win rate begins to taper down when 13 or more relationships are involved.
Engagement
High engagement consistently led to more deals won, whilst low engagement was a consistent issue with closed deals lost
Alongside relationships, engagement is a metric all too often overlooked. Taking the time to nurture those key connections with the buying committee clearly has a tremendous impact. Using the Ebsta score (more on that in the report..) we can now measure that engagement with contacts and accounts.
Therefore, we can now see the quality of the engagement with deals won and lost. If deals are low in engagement, then the data suggests they are likely heading to being closed lost. This was consistently seen throughout the year, regardless of a pandemic.
If deals are high in engagement, then the likelihood is that it’s heading towards success. The only question you should be asking yourself then is - how do we accelerate the deal through the pipeline?
With this in mind, it’s clear that relationships and engagement should be being measured as early indicators of success. When you only have a handful of relationships and the engagement is poor - is this a realistic target to continue to pursue? Or is your time better spent on other opportunities which are more likely to yield a successful result?
Highly engaged deals have a win rate of 50%, more than double compared to low engagement deals
Like relationships, it’s well known that engaging key decision makers is vital to closing a deal - and yet it’s so rarely measured. When we do measure this metric, we see the impact is profound - highly engaged deals had a win rate of 50%.
In short, when key stakeholders are effectively engaged, the chances of success are more than doubled. So in theory, if you were measuring engagement and scoring consistently in the 81-100 bracket, the chances of success would also be doubled too.
In the report, we also explore the influence of engagement on the other KPIs too, particularly sales cycle where it has a similarly staggering effect. By being data-driven, we can now begin to understand the underlying factors influencing KPIs. Crucially, this now begins to tell us where to focus our efforts to begin finding incremental gains to improve the overall results of those KPIs.