


Salesforce Reports Best Practices (with Examples)
In this age of information overload, more companies are relying on data to offer actionable insights. The big question is; how can sales teams visualize their sales data to inform decisions and evaluate performance?
What Is a Salesforce Report?
Salesforce reports are defined as a visual representation of sales data. The information presented in a report can be filtered according to different durations and can offer real-time data. Sales reports are beneficial for sales teams.
They provide an overview of KPIs to help determine how your sales team is performing in relation to your objectives and revenue targets. Sales reports can be used to evaluate sales performance, make decisions, award incentives and bonuses, and identify issues in the sales process.
What Are the Best Salesforce Reports?
There are many different kinds of Salesforce reports that your business can employ. Every business has unique tracking and reporting needs, but these five examples should provide a few of the best Salesforce reports for you to consider implementing in your organization.
1. Traditional Funnel Chart
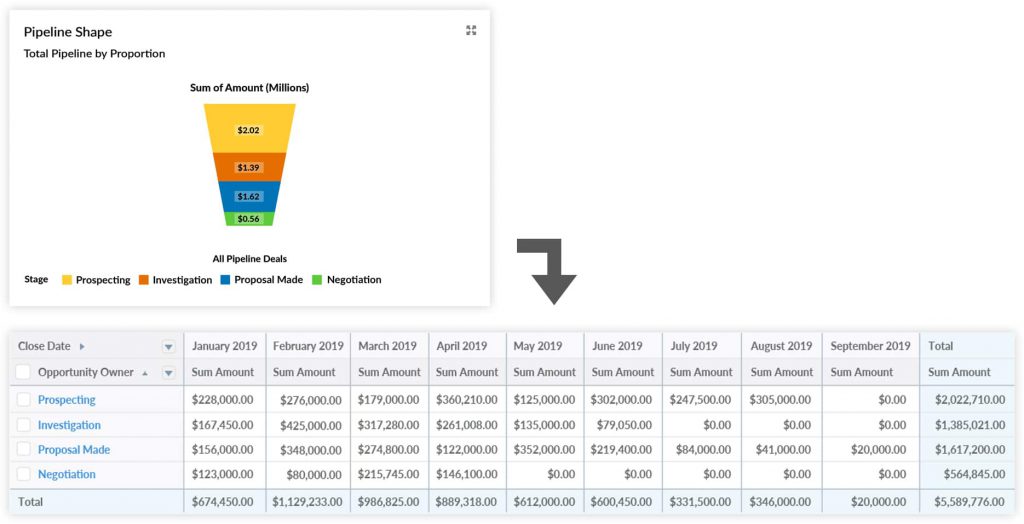
The funnel chart offers valuable data into how sales and marketing are working collaboratively. It merges the sales and marketing department because they use the same dashboard to make data-driven decisions.
With this report, you can identify whether marketing is generating leads and whether the leads are converting. If the leads are not converting, maybe the sales reps are delaying before they pursue leads or perhaps marketing is not qualifying the leads correctly.
2. Top 10 Pipeline Customers & Prospects
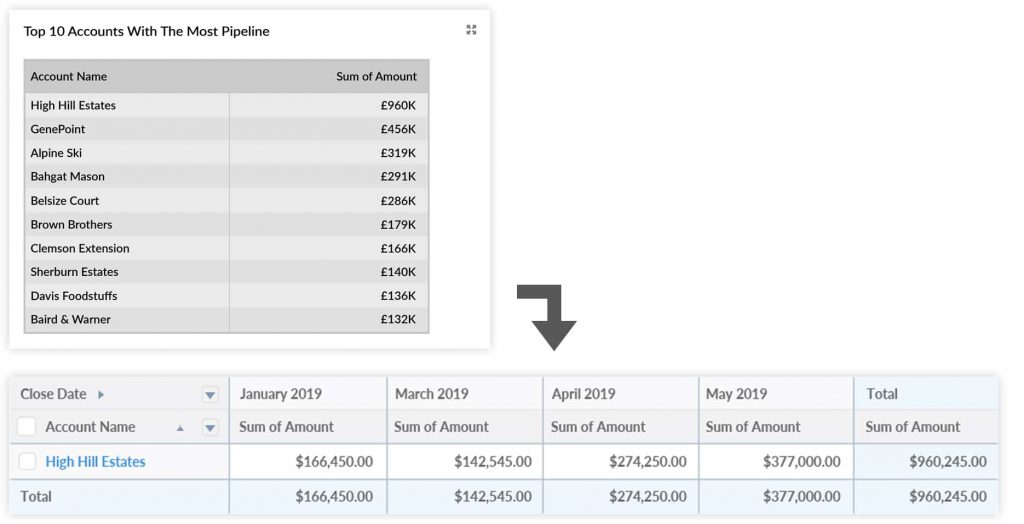
In most companies, salespeople can immediately name their prospects. However, what about the top 5? Or the top 10?
This Salesforce report chart shows the customers and prospects ranked by total pipeline. This information helps managers and salespeople prioritize their time and attention. It means salesperson effort, time and other resources are focused on areas where they are likely to have the most significant impact.
Displaying the information in a report is an excellent way of focusing attention on the top Accounts. Limit the report to the top 5, 10, or 15. Then on the underlying report, list all Accounts with Open Opportunities.
3. Closed Won Opportunities by Month
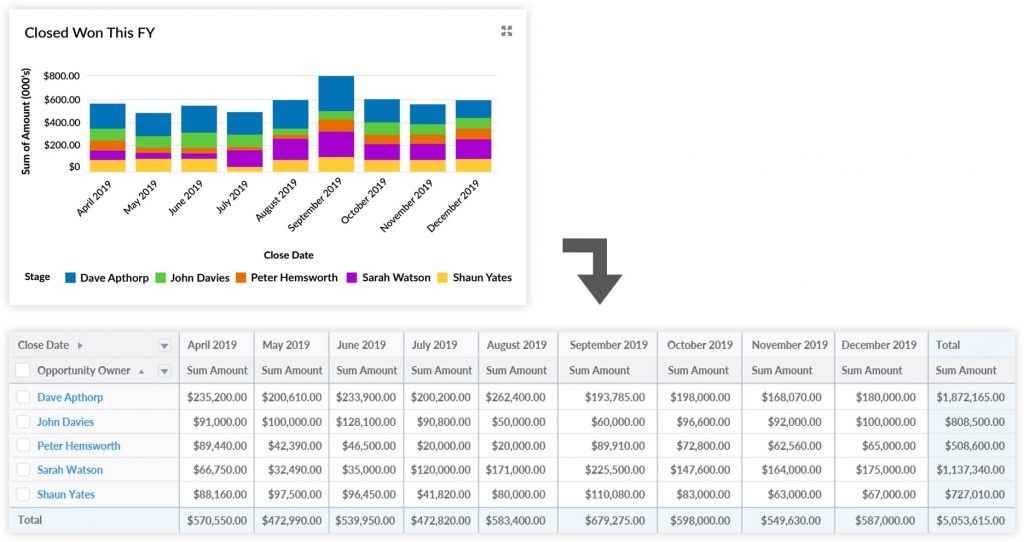
We all want to know the figure for sales revenue won in the year. That’s what the Closed Won Opportunities by Month report tells us. It shows how much sales revenue the company achieved during the financial year.
NOTE: You can summarize the information by each salesperson. If you have a larger sales organization, then group the report by team, country, or territory.
The report delivers essential insight into sales performance.
4. Open Opportunities by Created Date
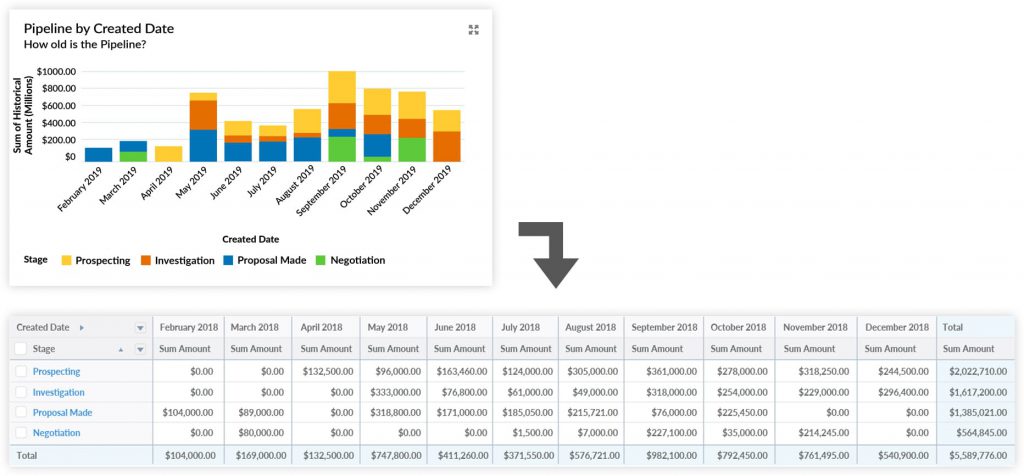
Here’s a simple but effective way to assess pipeline quality. It’s the Open Opportunities by Created Date.
This report shows the existing funnel, summarized by Created Month and current Stage. You may also want to create a similar report that displays the information by Created Month and Opportunity Owner.
The report tells us two things:
- How much pipeline was created each month. That’s important because all other things being equal, more pipeline means increased future revenue.
- The report is a pipeline-quality reality check.
5. Sales Performance vs. Target
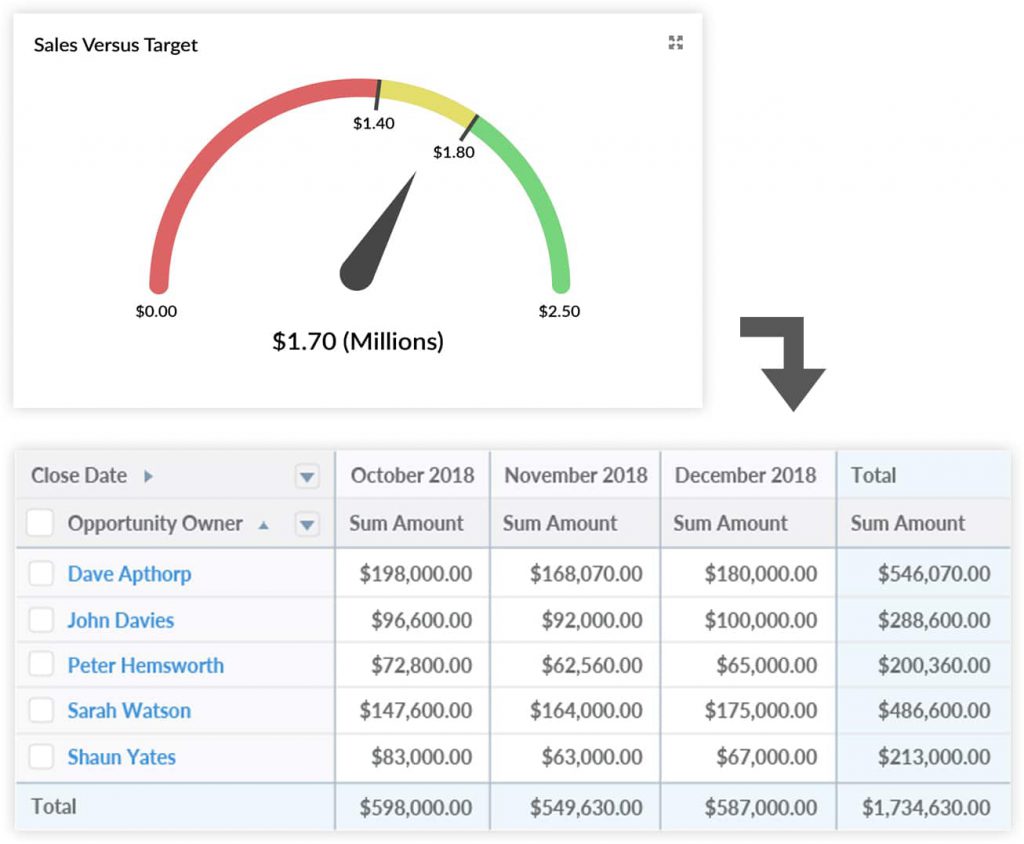
You might be wondering where’s the Target tab in Salesforce? Well, there isn’t one. That’s unfortunate because measuring sales performance against targets is a fundamental aspect of managing a sales team.
So how do you measure sales versus target or quota? There is only one way to do this in Salesforce:
Use the Forecasts tab.
The Forecasts Tab is the standard Salesforce feature for target tracking. It includes the ability for managers to override their team members’ targets. Unfortunately, the Forecasts function is complex; salespeople and managers need significant training to use it effectively.
Need Help Creating Salesforce Reports?
Whether you are a Sales Manager or a Rep, reports can make your life easier by revealing opportunities for improvement and informing decision-making. You don’t have to wonder how your sales team is performing or spend countless hours going through documents and spreadsheets; you can get all your answers with one click.
While we are here…the Ebsta Engagement score has been blowing the minds of sales managers and leaders.
Imagine being able to see the real engagement of your reps and their pipeline as driven by actual communication data?
Ebsta Team connects all the communication data (emails, calendar invites and calls) your sales team produce to arrive at the Ebsta Engagement Score, find out more by requesting a demo here.
 |
Guaranteed Forecast Accuracy |
|---|---|
We guarantee to achieve accurate forecasts to +/- 10% of your number within 6 months. Got questions? Email [email protected] Need a demo? Book 30 minutes and see how we guarantee accurate forecasts. |
|
Table of Contents
Share this article
Sign up for Insights
Learn from the brightest minds how to predictably and efficiently grow revenue.
Related Content
Why 52% of New Revenue Now Comes From Existing Customers
In this episode of Revenue Insights, host Guy Rubin sits down with Ben O’Mathuin, Principal Consultant at Customer Lift, to explore how companies can transform Customer Success (CS) from a retention function into a strategic revenue driver. Discover why traditional QBRs are becoming obsolete, how to create meaningful C-suite engagement, and the practical frameworks for…
The Essential Sales Tech Stack for Startups (Without the Bloat)
A sales tech stack is the collection of tools your sales team uses every day to generate pipeline, connect with prospects, and close deals.
Ebsta and Fullcast: Better Together
In 2021, Gartner research predicted that 75 percent of companies would be using a RevOps model by the end of 2025. Revenue operations is arguably the most talked-about topic in recent months. However, it still feels like the revenue engine powering most go-to-market teams today is running on fumes, and no one’s admitting it. Misaligned…