


Gap Between Top and Bottom Sellers is Growing
In the dynamic world of sales, performance disparities among sales representatives have become increasingly pronounced.
Recent data from our 2025 GTM Benchmarks Report indicates the gap between top and bottom performers, previously x8.9 in our 2024 H1 Update, has expanded to x11. This widening chasm underscores the importance of understanding and optimizing sales metrics to enhance team performance.
Key Performance Indicators Highlighting the Disparity
Several metrics from our 2025 Report illustrate the stark differences between top-tier and lower-tier sales performers:
- Deal Volume: Top performers manage 164%* more deals than their lower-performing counterparts.
- Average Contract Value (ACV): The ACV for top performers is 76%* higher, indicating their ability to secure more substantial deals.
- Win Rates: Top performers boast win rates that are 43%* higher, reflecting greater effectiveness in closing deals.
- Sales Cycle Duration: Top performers have sales cycles that are 42%* shorter, enabling them to finalize deals more swiftly.
This has all contributed to the speed at which top and bottom sellers perform (the velocity delta) widening each year to its current level of x11.
Understanding Sales Velocity and the Velocity Delta
A pivotal metric in assessing sales performance is Sales Velocity, which measures how quickly revenue is generated. It is calculated using the following formula:
Deal Count × Average Deal Value × Win Rate / Average Sales Cycle = Sales Velocity
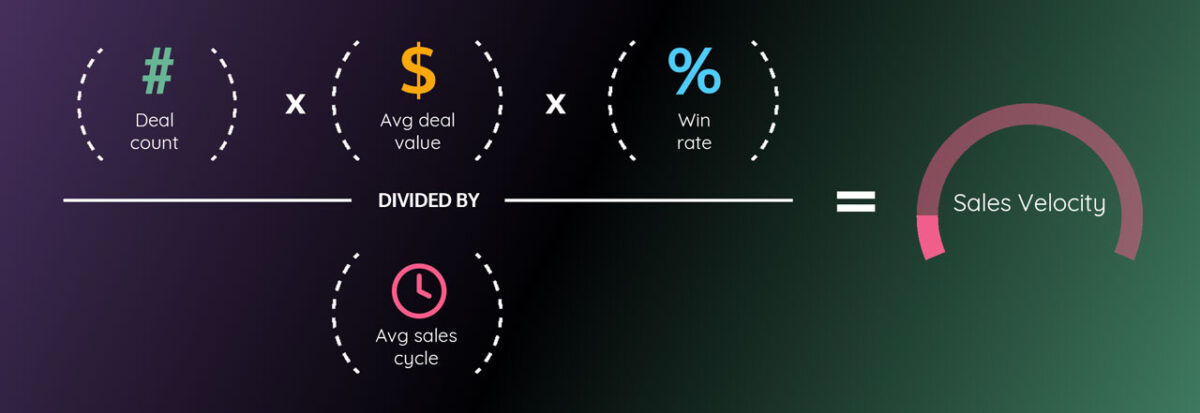
Where:
Deal Count: Total deals a salesperson is handling.
Average Deal Value: Mean monetary value of the deals.
Win Rate: Percentage of deals successfully closed.
Average Sales Cycle: Average duration to close a deal.
The Velocity Delta refers to the ratio of sales velocities between top and bottom performers. For instance, if a top performer has a sales velocity of $10,000 per day and a bottom performer has $1,000 per day, the velocity delta is 10.
“The widening velocity delta isn’t just a reflection of individual talent—it’s a sign that AI, data-driven decision-making, and structured sales enablement programs are becoming critical differentiators,” says Mark Ma, Data Scientist at Ebsta. “Organizations that fail to equip their teams with the right tools and insights will see this gap continue to grow.”
Comparing this delta to the industry average of 11 provides insight into a company’s relative performance.
Caution When Calculating Sales Velocity
Sales velocity can be measured at individual, team, or organizational levels. Many businesses also analyze sales velocity by market segment, as performance metrics can differ significantly.
For example, a B2B SaaS company selling to small businesses, mid-sized firms, and enterprises will see significant variations in customer lifetime value (CLV) and sales cycles across these segments.
However, the accuracy of your sales velocity calculation depends on the precision of the data you use.
Be mindful of sales cycle timing when measuring win rate. Deals closed within the current period may have originated in a prior cycle, and current opportunities may not close until the next period. To address this, teams can either assume these discrepancies will balance over time or use a cohort analysis for a more precise measurement.
The sales cycle measures how long it takes for a lead to move through the pipeline from initial engagement to closing. This duration can be expressed in days, weeks, or months. While reducing the sales cycle can improve efficiency, shorter isn’t always better. Some products and services require longer lead nurturing, particularly for high-value or complex solutions.
Sales Velocity Example Calculation
Consider a B2B sales team with:
50 deals in the pipeline
An average deal size of $2,500
A win rate of 35%
An average sales cycle of 28 days
Applying the sales velocity formula:
Sales Velocity = 50 × 2,500 × 35% / 28
This means the team generates $1,562.50 in revenue per day or approximately $43,750 monthly.
By tracking sales velocity over time, you can compare it against weekly, monthly, or quarterly sales targets. If your team is on track, that’s a positive indicator. If not, you can analyze key metrics – such as win rates, deal sizes, or sales cycles – and make strategic adjustments to improve performance.
Strategies to Narrow the Performance Gap
While calculating sales velocity is straightforward, interpreting and applying it to your strategy can be more complex. Here are key ways sales velocity can inform decision-making across your organization.
Sales Coaching
If a salesperson has a low sales velocity, it may indicate the need for individual coaching. If multiple team members struggle in similar areas, it could highlight gaps in your sales enablement strategy that require broader training.
However, one of sales leaders’ biggest mistakes is coaching solely to sales velocity. Setting a goal to “increase sales velocity” is ineffective because it relies on multiple variables – number of leads, deal size, win rate, and sales cycle – many of which may be beyond a seller’s control.
Asking sellers to “sell more” or “sell faster” without clear, actionable steps can be counterproductive.
Additionally, pushing sales teams to increase sales velocity without proper guidance can lead to inflated pipeline numbers. Sellers may overestimate deal sizes or include low-quality opportunities, which can create misleading forecasts.
Instead, focus coaching on specific behaviors and tactics that influence velocity’s key components, such as:
- Teaching sellers how to identify high-value, high-intent leads early in sales.
- Refining talk tracks and discovery techniques to ensure sales people ask the right questions and fully understand customer needs.
- Implementing upselling and cross-selling strategies to maximize deal size.
- Evaluate demo delivery to ensure sellers effectively articulate value and follow a structured sales process.
Client Success Alignment
A high sales velocity can signify that your client success team needs to scale alongside sales. If sales are growing rapidly but customer retention is lagging, your post-sale support team may be struggling to keep up.
This is a common challenge for companies in the scaling phase. Many invest heavily in new business acquisition but fail to balance it with customer retention efforts. Before doubling down on increasing sales velocity, assess your customer retention rates.
If churn is rising, it may be time to reallocate resources toward customer success.
Sales Process Optimization
Low sales velocity doesn’t always reflect individual performance – it can also indicate operational inefficiencies. Bottlenecks in your sales process, outdated technology, or a lack of automation can slow down deal progression and negatively impact velocity.
Common issues that hinder sales velocity include:
- An inconsistent sales process across different segments (e.g., company size, industry, or product line).
- Cumbersome CRM and pipeline management software that creates administrative burdens.
- A lack of automation for repetitive tasks, increasing manual workload and reducing selling time.
To address these issues, consider:
- Standardizing the sales process for different market segments to ensure consistency.
- Upgrading or optimizing CRM and revenue intelligence software to streamline deal tracking and follow-ups.
- Implementing daily activity metrics to better understand inefficiencies and time allocation.
Strategic Hiring Decisions
Sales velocity can also serve as a useful benchmark for determining when to expand your sales team. A consistently low sales velocity may simply indicate that your team is understaffed.
When sales teams are stretched too thin, their ability to generate and convert leads suffers. This, in turn, affects win rates, quota attainment, and overall morale. If your velocity numbers are consistently low despite strong individual performance, it may be time to hire additional reps to ensure sustainable growth.
Summary of Growing Gap Between Top and Bottom Sellers
Sales velocity is a powerful metric, but its real value lies in how you use it. Rather than focusing on the number itself, analyze its underlying drivers and make strategic improvements.
Our 2025 GTM Benchmarks Report shows whether through targeted coaching, better sales processes, stronger client success support, or team expansion, optimizing sales velocity can unlock new levels of efficiency and revenue growth.
 |
Get Your GTM Score |
|---|---|
Will you get 100%, 47% or something lower? Take 3 minutes to answer 10 questions and get a percentage score plus some AI-generated advice about your GTM performance. www.ebsta.com/gtmscore |
|
Table of Contents
Share this article
Sign up for Insights
Learn from the brightest minds how to predictably and efficiently grow revenue.
Related Content
Why 52% of New Revenue Now Comes From Existing Customers
In this episode of Revenue Insights, host Guy Rubin sits down with Ben O’Mathuin, Principal Consultant at Customer Lift, to explore how companies can transform Customer Success (CS) from a retention function into a strategic revenue driver. Discover why traditional QBRs are becoming obsolete, how to create meaningful C-suite engagement, and the practical frameworks for…
The Essential Sales Tech Stack for Startups (Without the Bloat)
A sales tech stack is the collection of tools your sales team uses every day to generate pipeline, connect with prospects, and close deals.
Ebsta and Fullcast: Better Together
In 2021, Gartner research predicted that 75 percent of companies would be using a RevOps model by the end of 2025. Revenue operations is arguably the most talked-about topic in recent months. However, it still feels like the revenue engine powering most go-to-market teams today is running on fumes, and no one’s admitting it. Misaligned…