1:1 Pipeline Reviews
Table of Contents

Close more deals with effective 1:1 pipeline reviews
Here's how:
1. How healthy is your pipeline?
See how your pipeline is progressing in one view
Before heading into the review, what managers want to know is how it’s going.
Instead of spending 30 minutes checking in and hearing it from their rep, they can spend 10 minutes inside Ebsta beforehand.
The big difference is not only can they see all the activity – they can also see changes to the close date, amount as well as the next step.
There’s also insight into how strong the relationship is, how likely the deal is to close (based on the rep’s historical performance), and if the deal is qualified.
Any change you make here (such as the next step) gets synced automatically back into your CRM.
So when it comes to the meeting itself, the manager and rep can spend their time discussing how to close the important accounts.
2. What deals need to be prioritized?
a. See deals no longer on track
We all love to talk about the deals progressing well – however, we can be reluctant to discuss the ones heading in the opposite direction.
With the Pipeline Change view, managers can quickly spot deals trending downwards (for example, the close date has moved back or the value has decreased) or are stalling (i.e. still in the same stage).
Not only will this give an overview of the deals at risk, but you can also then dig deeper into each opportunity to see why.
Using AI, we analyze historical performance to gauge how the deal is progressing relative to your benchmark. So you will be notified if a deal has been in stage longer than usual.
b. Spot deals at risk
Hitting quota requires prioritizing the right deals – and preventing key target accounts from slipping.
The problem with this normally is a lack of visibility of when it is happening.
No longer. Plugging into your CRM lets you see when deals are at risk well in advance.
For example, you can spot when the close date has moved back, the amount decreased or when engagement is declining.
c. Why will we win this deal? How do we plan to close this deal?
As deals run for weeks and months, losing sight of the end goal can become easy.
To help reps proactively pursue deals – and to support managers in helping them get there, you can qualify and update opportunities inside your CRM.
The added benefit is access to predictive insights such as the Relationship Score (effectiveness of activity) and the Deal Score (likelihood of the deal to close) to guide these conversations.
Both scores draw from your historical performance to deliver an AI-powered score.
With the relationship score, sales team can prioritize engagement with priority accounts and ensure they are effectively multi-threaded.
With the deal score, teams can how likely deals are to close – enabling them to more effectively prioritize the most important deals in their pipeline.
Lastly, with deal qualification, you can implement your sales methodology inside your CRM. For example, implement MEDDPICC® and qualify deals inside Salesforce or Hubspot.
3. Call your forecast with confidence
What will the commit and upside be?
The root cause of inaccurate forecasts is very often gut-feeling decisions from frontline sellers.
Rather than submitting forecasts in a spreadsheet at the end of the week – there’s a better way.
Call your forecast with confidence – using the insights to support your decision.
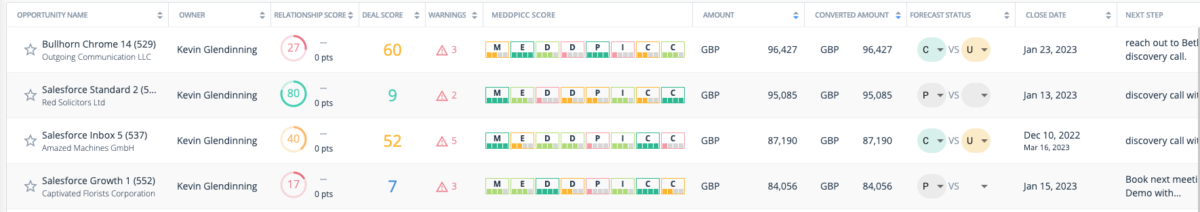
In the Opportunity Table, not only can sales teams pull on predictive scoring on how likely deals are to close, they can refer back to qualifying information when calling their forecast.
When it’s time to forecast, instead of doing it all at once in a spreadsheet – now you just need to select a dropdown whenever reviewing your pipeline. Pipeline (P), Upside (U) or Commit (C) are all configurable to suit your sales process.
When you have gone through all of your opportunities these will be totaled in the Forecast Submission Tab.
Check that these figures make sense to you. Click the figure in Total Amount to copy this figure to My Forecast- you can edit it if necessary. Add any supporting notes and finally submit your forecast using the blue Submit button.