Share this article
Learn from the brightest minds how to predictably and efficiently grow revenue.
Related Content
Bringing Revenue Intelligence to Salesforce
Have you ever tried to build furniture without the instructions? You can follow your gut and may end up with a completed project – but there will always be a few screws left over. Your sales team can feel like that too. Their CRM may show them the parts – but without the data and…
See how forecast submissions have changed with Ebsta Waterfall
Waterfall Chart shows how your team's commit and upside forecasts have changed, and more importantly - understand which opportunities drove this change.
The Ultimate Forecast Submission Tool for Managers
New view for managers to review their teams pipeline, inspect their opportunities and change the forecast status.

Turn insight into action with Pipeline Insights
Healthy pipeline is essential to an effective sales operation. How often have you failed to meet quota because a deal slipped and you didn’t have enough pipeline to cover it?
Ebsta offers you insight into the health of your pipeline and how it is trending over time. This allows you to diagnose deals at immediate risk and prevent them from slipping. We are still offering the same great insights but now we have a new user interface (UI) for our pipeline insights to make it even easier to find exactly what you’re looking for.
See how every deal is progressing with Pipeline Insights
Pipeline Insights give you complete pipeline visibility so you can identify deals at risk before it’s too late. By automatically capturing activity and scoring engagement, sales leaders have better insight into what’s really going on with each opportunity and how the rep or team are performing.
The Pipeline Insights dashboard enables you to quickly review your team’s pipeline and deep-dive into every opportunity – allowing you to understand relationships, changes to close date & amount and previous communication.
Ebsta monitors pipeline changes in real-time and highlights deals progressing slowly, have no activity or are suffering from a lack of engagement. Armed with this information, you can make a plan for next steps to get them back on track.
Do you struggle to identify risk in your pipeline?
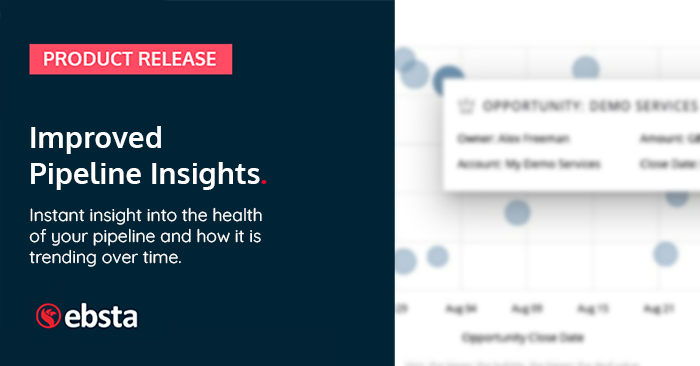
Then you are going to love our Opportunity Horizon Chart. This shows you at a glance all of your opportunities and in particular those at risk in your pipeline.
Every bubble is an opportunity and is plotted against Engagement Score and expected close date. The size of the bubble represents the deal value, for example, the bigger the bubble, the bigger the deal size. To identify risk – look for opportunities late in stage and with low engagement.
You can use the Opportunities Filters to find the information you need fast. Whether you want to filter by opportunity type, deal stage, close date, amount, Engagement Score or by a particular user/team, this information is available at your fingertips.
Simply hover over a bubble and it will display key information relating to that Opportunity including the opportunity name and owner, the account it relates to, deal value, close date and the Engagement Score.
Now you’ve spotted the risk – let’s explore these opportunities in more detail.
The Opportunity table enables you to explore a particular opportunity in detail. The filters you applied previously will apply here also, for example if you filtered by a particular user only their opportunities will be shown in the table.
The green are positive and the pink negative indicators; for example, if the deal value goes up, the box will turn green, if the close date is pushed back the box will turn pink.
If you click on any row within the table, it will highlight the opportunity in the Horizon Chart above by turning it orange so you can see instantly how at risk it is. These insights will prove invaluable in understanding the health of every opportunity in your pipeline and enabling you to plan next steps and ensure they close.
Review every opportunity without leaving the console.
The Ebsta Insight sidebar displays positive and negative factors, all opportunity activity and the Deal Qualification Guide (MEDDPICC®) of every opportunity.
You can use this to identify risk within your pipeline and to plan next steps. For example using the Ebsta Deal Qualification Guide you may notice that there is no economic buyer engaged with an opportunity. Armed with this information you can plan your next steps accordingly and identify this individual.
Even better, all of these insights are available within your Salesforce account. So whether you are reviewing your pipeline ahead of a 1:1 pipeline review or preparing for your forecast call, Ebsta is there in your CRM to give you the data you need. Giving you the visibility you need to improve forecasting accuracy, identify pipeline at risk and increase sales performance.
One of the key strengths of Ebsta is that it provides insights to all members of your team – from CRO to Sales Rep. This allows everyone to extract the same level of insight and data into their opportunities and increase their chance of success.
Our new and improved Pipeline Insights are available to customers with the following subscriptions today;
- Professional
- Ultimate
To begin empowering your reps (if you are not already using Ebsta) then get connected today.
MEDDPICC® is a registered trademark of Darius Lahoutifard, exclusively licensed by MEDDIC Academy, and is being used with permission.


