


The Secret To Rapid Growth: Sales Process Optimization
The saying goes – “If it ain’t broke, don’t fix it”. But when you wait for things to break, you leave cracks which leak revenue.
Sales process optimization is about identifying gaps in your sales strategy allowing you to grow faster.
It is not just about making more deals (this is just a bonus). And guess what? It’s not complicated!
This is a step-by-step guide to learning how you can optimize your sales process at every stage of your sales cycle.
Why this guide is different to others
Businesses often look at their processes as a whole.
But here is the secret to unlocking consistency, visibility and predictability…
The key is pinpointing how successfully and how quickly prospects are advancing to the next stage and more importantly understanding why they are happening.
This means analyzing every stage to find those all-important marginal gains. How?
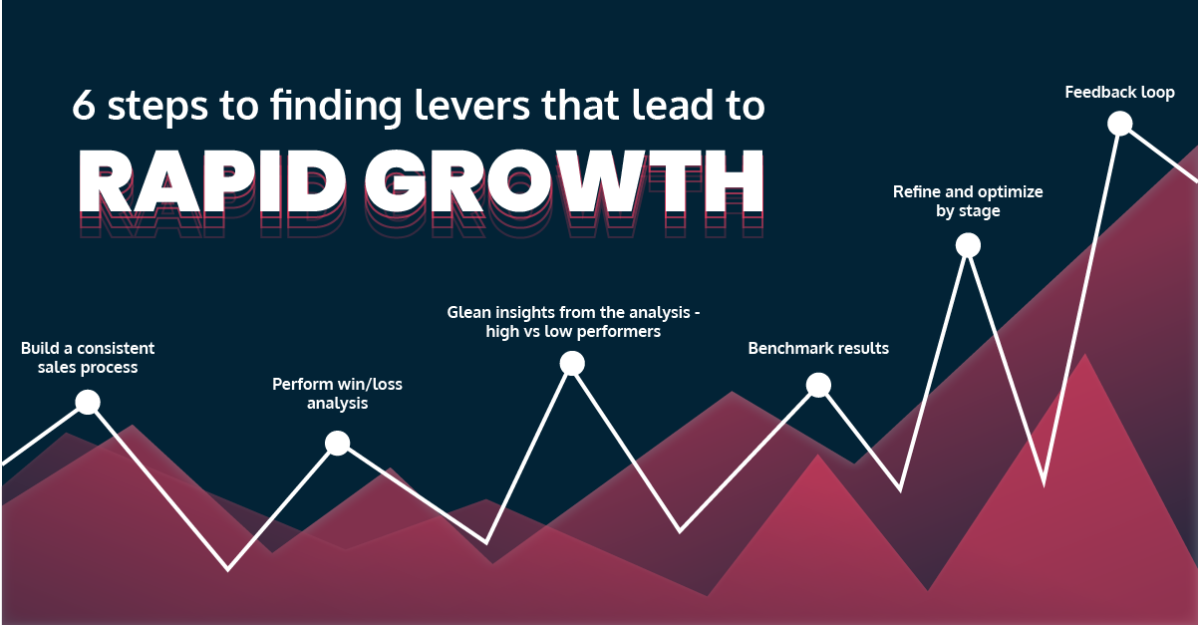
6 steps to finding levers that lead to rapid growth
- Build a consistent sales process
- Perform win/loss analysis
- Glean insights from the analysis – high vs low performers
- Benchmark results
- Refine and optimize by stage
- Feedback loop
Build a consistent sales process
A consistent sales process allows you to easily identify what areas of your sales process you need to refine and optimize.
This is the first step in creating visibility across your sales team.
In fact, Harvard Business Review discovered that sales forces were “most effective in managing their sales pipelines if they had invested time in defining a credible, formalized sales process.
There was an 18% difference in revenue growth between companies that defined a formal sales process and companies that didn’t.”
How do you create consistency?
- Clearly defining your sales stages – it increases pipeline visibility so sales reps can accelerate deals through their pipeline and managers can stay on top of how things are progressing allowing them to provide feedback to their reps in real-time.
- Introducing a solid structure to your sales process – standardizing your sales meetings can get a complete picture of pipeline health and address areas needing attention.
Defining both your sales stages and sales process ensures that everyone on the sales team is operating in the same way.
Performing a win/loss analysis
A win/loss analysis allows you to dig into how each individual rep is performing at each stage of the sales cycle.
Why a win/loss analysis is powerful
Average sales turnover is 35 percent, higher than the average for all other industries at 13 percent – HubSpot
With the turnover of salespeople being extremely high as well as increasing sunk costs, you want to ensure that every sales rep is performing well.
The average sales rep does not exist.
A win/loss analysis helps to identify your high and low performers at each stage. How?
It looks at your historical data to find patterns and trends in the way you operate.
Gleaning insights from the analysis – high vs low performers
If your sales reps are consistently converting prospects into opportunities, then this is considered a ‘win’.
Or if your reps are losing deals at the negotiation stage then this highlights a problem in your process and is therefore considered a ‘loss’.
The examples above look at sales reps as a group but the same insights for individual reps should also be analyzed. Why?
To separate your high and low performers.
This information allows you to iron out your weaknesses and play to your strengths.
For example, if one of your sales reps has a high conversion rate from discovery to the next stage, their approach can be adopted across your entire sales team.
So sales leaders would be looking for specific aspects of that reps discovery process that result in conversion such as:
- Do they spend time researching the prospect before discovery?
- Have they set a clear agenda for the meeting?
- Do they ask open-ended questions or closed questions?
- Is there a particular discovery question that is working well for them?
Whilst these may seem like small changes, over time these improvements compound, generating bigger and better results as the business scales.
Benchmark results
Benchmarking looks at your previous performance to provide you with a point of reference on how you should be performing.
It allows you to understand if you are on track to close and if you are not, it gives you the opportunity to salvage those deals.
Here is a more specific example of benchmarking:
As you can see below, the benchmark for time spent on the qualifying stage is 25%.
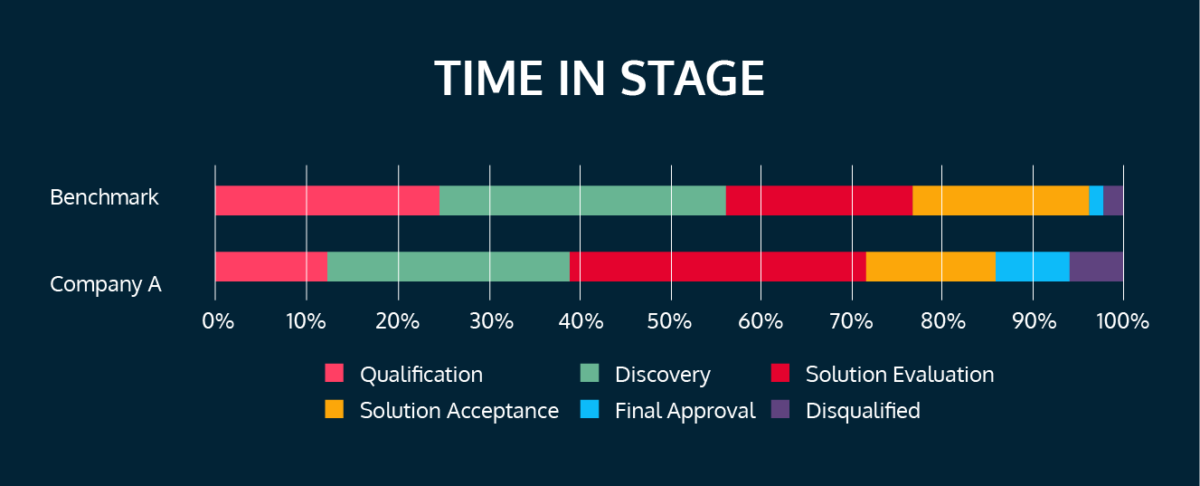
What can you learn from this?
If less time is spent on qualifying, the likelihood of your deal closing decreases. Why?
Because the prospect might not be a right fit for your product, it might not be the right time for them to invest in your product, the prospect might not have the budget at this time etc.
This benchmark highlights why salespeople should be taking their time to really understand their prospect through qualification.
This is only one example of the benefits of benchmarking: you can drill down into performance gaps and identify areas for improvement.
Benchmarking allows you to…
Refine and optimize by stage
Compare your benchmarks to how you are currently performing to quickly identify where you need to improve.
Here is an example:
If there is a dramatic difference between the benchmarked time in stage in discovery and your time in discovery, this indicates you should investigate how the rep is doing discovery.
- Is it still effective?
- Are they spending too long doing it?
- Is their due diligence in taking more time helping to close the deal faster later?
Benchmarking allows you to spot where there are discrepancies, then you can investigate further to find where improvements can be made
This is how you can use benchmarking to improve your processes at the stage level rather than on the whole.
Engagement by stage
We analyzed 1.6 million sales opportunities to uncover that relationships and engagement are the biggest factors influencing revenue success.
Engagement is a metric that not only considers the volume of activity (phone calls, emails, meetings) but the duration, direction and the recency of activity.
Benchmarking engagement by stage allows you to see how engagement affects stage movement.
We found that engagement levels have a direct impact on whether an opportunity is closed-lost or won.
Engagement was especially critical at the discovery and solution evaluation stage.
The average engagement on deals that were lost was 42%.
Whereas, the average engagement for discovery and solution evaluation to move to the next stage was 68%.
Diving into engagement on deals lost versus deals that moved to the next stage tells you how much engagement you need to maintain at each stage to give your deal momentum.
Here is a practical example:
The benchmark for engagement might be 70% at the solution acceptance stage.
If you currently have 50% at this stage, you know you need to take immediate action with that account to get engagement up to 70%.
Otherwise you risk losing this deal as the level of engagement is not sufficient to move the deal to the next stage.
Feedback loop
Now, you have benchmarked, refined and optimized your sales process, you are not finished.
This is an ongoing process that needs to be nurtured.
A feedback loop is:
- When you sell
- Measure your sales data
- Use that information to improve your sales processes
- Introduce improvements to your sales cycle
- Sell some more and do it all over again.
Benefits of sales process optimization
Repeating these 6 steps means that every one of your sales reps are a high-performer and your entire team is performing in the most effective way possible.
Starting at step 1, you unlock a new level of visibility into your pipeline.
All the way to step 5 where you iron out weaknesses and play to your strengths. This is where you really improve performance, drive more wins, and generate more revenue.
These 6 tried and tested steps for sales process optimization are designed to find the levers that unlock rapid growth for your business. Will you be implementing this approach?
 |
Guaranteed Seller Quota Attainment |
|---|---|
We guarantee to improve your sellers’ quota attainment within the first 6 months. Got questions? Email [email protected] Need a demo? Book 30 minutes and see how we guarantee quota. |
|
Table of Contents
Share this article
Sign up for Insights
Learn from the brightest minds how to predictably and efficiently grow revenue.
Related Content
Why 52% of New Revenue Now Comes From Existing Customers
In this episode of Revenue Insights, host Guy Rubin sits down with Ben O’Mathuin, Principal Consultant at Customer Lift, to explore how companies can transform Customer Success (CS) from a retention function into a strategic revenue driver. Discover why traditional QBRs are becoming obsolete, how to create meaningful C-suite engagement, and the practical frameworks for…
The Essential Sales Tech Stack for Startups (Without the Bloat)
A sales tech stack is the collection of tools your sales team uses every day to generate pipeline, connect with prospects, and close deals.
Ebsta and Fullcast: Better Together
In 2021, Gartner research predicted that 75 percent of companies would be using a RevOps model by the end of 2025. Revenue operations is arguably the most talked-about topic in recent months. However, it still feels like the revenue engine powering most go-to-market teams today is running on fumes, and no one’s admitting it. Misaligned…